使用 IQTREE 计算一致性因子
关于谱系不完全分选和渐渗
注意:该前言部分使用 ChatGPT4.0 生成并由 Juse 纠正总结,图源自维基百科。
问题:请介绍一下谱系不完全分选(ILS)和渐渗(introgression)对推断系统发育关系的影响,随之引出基因一致性因子(gene concordance factor)和位点一致性因子(site concordance factor)的概念并介绍它们的作用。
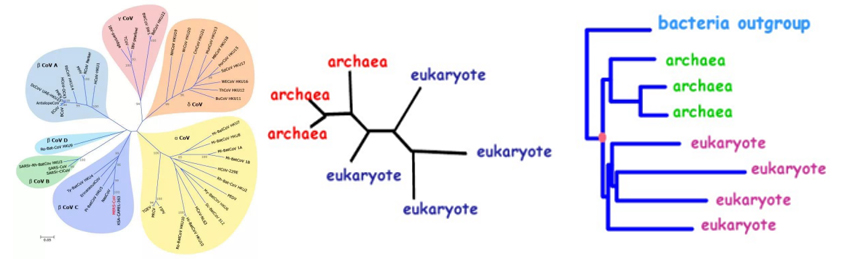
在生物学中,推断不同物种的系统发育关系是一个核心课题。然而,系统发育树的构建很复杂,可能受到多种因素的影响。这里我们着重介绍两个重要因素:谱系不完全分选(Incomplete Lineage Sorting,简称 ILS)和渐渗(Introgression)。
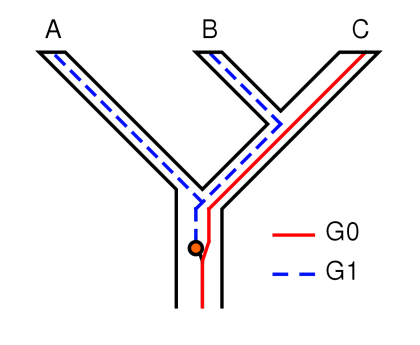
- 谱系不完全分选 (ILS): 谱系不完全分选发生在物种分化的过程中。当两个物种在很短的时间内分化时,一些基因座可能没有足够的时间来完全分化,因此这些基因座在不同物种之间可能会保留共同的祖先多态性。这意味着即使两个物种已经分化,它们的一些基因序列可能仍然相似。这在系统发育树的构建中会引入混乱,因为它可能导致基于这些基因的树与真实的物种树不一致。
- 渐渗 (Introgression): 渐渗是指一个物种的基因通过杂交和回交进入另一个物种的基因库的过程。这通常是通过自然的或人为的杂交事件发生的。渐渗的结果是,两个原本是独立进化的物种在其基因组中出现了相互混合的部分。这在系统发育分析中会引起问题,因为基于混合基因的树可能会误导我们认为两个物种比实际上更为接近。

为了解决这些问题,研究人员引入了 “基因一致性因子”(Gene Concordance Factor,简称 GCF)和 “位点一致性因子”(Site Concordance Factor,简称 SCF)这两个概念。
- 基因一致性因子 (GCF): GCF 用于测量不同基因的系统发育信号与某一特定的参考拓扑结构的一致性。它计算的是支持给定物种树拓扑结构的基因的百分比。如果 GCF 值接近 1,这意味着大多数基因支持该参考拓扑;而如果 GCF 值较低,这意味着基因之间在支持的物种树结构上存在较大差异。
- 位点一致性因子 (SCF): 与 GCF 类似,SCF 用于测量单个位点的系统发育信号与参考拓扑的一致性,为支持分支的信息位点比例。
通过使用 GCF 和 SCF,研究人员能够更准确地评估基因和位点数据对系统发育树的贡献,从而更有效地解决因谱系不完全分选和渐渗引起的问题。
运行方法
IQTREE 官方文档(重应用):http://www.iqtree.org/doc/Concordance-Factor
IQTREE 开发者亲自教学(重理解):http://www.robertlanfear.com/blog/files/concordance_factors.html
本文就其中重点进行阐述介绍。
由于新的基于最大似然法计算 sCF 的方法在 IQTREEv2.2.2 以上才提供,因此请确保自己的版本已经足够。
新版本的下载和安装可以前往:https://github.com/iqtree/iqtree2
懒人版命令:
1 | wget https://github.com/iqtree/iqtree2/releases/download/v2.2.2.6/iqtree-2.2.2.6-Linux.tar.gz |
完成所有命令以后,你应该就可以直接通过 iqtree2 命令调用软件了。
如果已经有了不同基因的比对序列文件(未串联)且存放在一个文件夹中,则可以使用以下命令计算 SCF GCG:
1 | infer a concatenation-based species tree with 1000 ultrafast bootstrap and an edge-linked partition model |
如果已经串联好了序列并且有分区文件,则可以使用以下命令计算 SCF GCG:
1 | infer a concatenation-based species tree with 1000 ultrafast bootstrap and an edge-linked partition model |
以上述命令为例,运行后将得到一系列文件,其中 concord.cf.stat 记录 GCF 信息,concord2.cf.stat 记录 SCF 信息。
如果想要可视化各个位点的信息,可以使用相应的树文件 concord.cf.tree 和 concord2.cf.tree。
此后的可视化等操作详细可看之前所提到的链接,这里将节选其中的某些重点:
- GCF 低的原因可能有:①、解析短序列和短分支的能力有限;②、许多基因中存在相互冲突的信号。此时 SCF 可以提供更多信息,如果导致 GCF 低的原因仅是基因树中的信号冲突,那么 GCF 和 SCF 应该是相近的。而如果 GCF 受到其他影响(有限数据的随机误差)那么它将比 SCF 低很多。
- 即使 GCF 和 SCF 低,可能也会得到一个非常高的自举值(支持率),因为 bootstrap 测量的是采样方差,而它们反映的是原始数据中的方差。有论文表明在一个长度为 137324 的比对中,17 个位点的差异(131 vs 114)就能让程序得到 99.999% 的支持率。因此这凸显了在大数据集中使用 GCF 和 SCF 进行补充的有效性。
- SCF 小于 33% 但该拓扑结构依然显示高支持率:可能是由于存在少数影响更显著的位点。
以下提供相关原文:
原文部分
The gCF is probably low for two reasons: our ability to resolve single locus trees is limited because they’re short (and this is a short branch in the tree, which makes things worse), and many of the loci contain genuinely conflicting signal. The sCF helps us dig deeper here – the sCF for this node is ~37%, suggesting that the low gCF is a combination of both factors. Roughly speaking we expect the gCF and sCF to be similar if the only thing causing a low gCF is genuine discordant signal in the single locus trees. If the gCF values are affected by other processes (e.g. stochastic error from limited information), then gCF values can be a lot lower than sCF values. An sCF of 37% shows that there is not overwhelming support for any particular resolution of this branch. A sensible biological interpretation here would be that this resolution of the tree is a good best guess for the species tree, but that there is plenty of conflicting signal meaning that: even if this is the correct resolution, there’s probably a lot of conflicting signal in the gene trees from processes like incomplete lineage sorting.
We can see a number of things from this. First, the branch is very short, and that’s probably most of the reason for the low gCF (short branches are hard to resolve, particularly with short loci). This is confirmed by the fact that although 87 of the 88 single locus trees could have contained this branch (gN = 87 in the table, meaning that 87 of the 88 gene trees could have contained that branch; these gene trees are called decisive in the preprint), only 1 of them did (1.15% of 87 is 1). Three other single locus trees supported a second resolution of the four clades around that branch (gDF1 = 3.45%, corresponding to 3 trees), and none supported the third resolution (gDF2 = 0%). The remaining 83 out of the 87 gene trees had a topology that wasn’t any one of the three possible arrangements of the four clades around this branch, which is a typical signal of noisy single locus trees. This highlights another important point – the most common resolution of this branch in the gene trees is NOT the one we see in the ML concatenated tree. There are at least two reasons this might be the case – we might be in the anomaly zone, or it might be that the informative sites for this tree are scattered around in all the noisy genes, such that individual gene trees really aren’t giving us much useful information here. The sCF and sDF values suggest that the latter explanation is true (see below). In itself, this highlights a limitation of methods that look to build a species tree from pre-estimated gene trees: when the gene trees are noisy, these methods will struggle.
But how can the bootstrap be so high, when the sCF is so low? This is because bootstrap values are measuring sampling variance, while the sCF is measuring the observed variance in the original data. This difference is important, and highlights why in many cases (especially for large phylogenomic datasets) gCF and sCF values are a useful complement to bootstrap values. Specifically, it makes it explicit that a very low sampling variance (e.g. 100% bootstrap support) tells you very little about the underlying variation in your data. An analogy might be useful here: imagine you collect height data from 1 million individuals in a population. Let’s say your data show that individuals can range from 4 feet tall to 10 feet tall, and that the distribution is almost uniform. If you calculate the mean of this distribution, and then recalculate it again and again from bootstrapped samples of your dataset, you’ll see that your sampling variance on the mean is very low because you have such a big dataset. But if you were to measure the variance of your raw data, you’d see that this is very high. A low sampling variance on the mean is analogous to a high bootstrap value (which indicates a low sampling variance on a branch in tree), and a high observed variance is like a low sCF value (which indicates high variance in the support that sites give for the correct resolution of this branch).
Felsenstein’s 1985 bootstrap paper gives us a formula which tells us that we should expect very high bootstrap support if we have 131 vs. 114 sites competing to resolve a single branch. Indeed, it says that the bootstrap support for a difference of 17 sites in an alignment of length 137324 should be 99.999% in favour of the resolution with the most supporting sites. Regardless, these sCF values tell us that despite a bootstrap support of 100%, the underlying data contain a lot of discordance (almost the maximum possible amount) around this one branch.
关于使用卡方检验计算 p 值确定是否存在谱系不完全分选的部分可以作为一个参考,以下我贴出通过两个文件计算 p 值的代码部分:
1 | library(dplyr) |
其中 allcf.csv 为全部节点的一致性因子信息文件(最后两列为相关 p 值),cf.csv 则仅保留了经卡方检验两个 p 值中有至少一个小于 0.05 的节点。
注意:该 p 值的解释需要谨慎,因为它没有考虑到一些因素例如连锁不平衡等。
后记
进化学领域中,关于 ILS 和 Introgression 的讨论一直存在,检测它们的方法也随之出现,经典的有 abba-baba test,复杂的也有应用了隐马尔可夫模型的 coalHMM 等软件。
但事实上本文讲到的一致性因子和这两个现象并没有绝对的关联,对于一致性因子而言,其最重要的作用是量化系统发育数据集的一致性,有助于帮助我们识别数据中的问题并严谨地对待得到的系统发育关系。
话虽如此,这些因子同样也能作为 ILS 现象是否存在的一个参考,为后续进行具体的 ILS 检测提供一定的先验理解。
感兴趣的话还可以看一看最近关于 ILS 的一些文章:
Pervasive incomplete lineage sorting illuminates speciation and selection in primates from Science
Incomplete lineage sorting and phenotypic evolution in marsupials from Cell
如果想对 GCF 和 SCF 有更充分的认识可以看以下文章:
New Methods to Calculate Concordance Factors for Phylogenomic Datasets from Mol. Bio. Evol.
Updated site concordance factors minimize effects of homoplasy and taxon sampling from Bioinformatics
最后用 R 的一个示例说明为什么基因数量的增加会提高支持率但是并不带动一致性因子的变化:
1 | library(boot) |
结果返回:
1 | 0.49967844 0.14973480 0.05184815 |
该代码通过 ChatGPT4.0 生成,其中三个数据均来自同一分布,但随着样本量的增加,采样均值的标准差明显减小。
但是一致性因子不同,可以理解为它关注的是原始数据集的分布,此时不管样本量多大它的分布性质依然是不变的。
接着我们再来举一个功效分析的例子:
1 | library(pwr) |
1 | Two-sample t test power calculation |
可以看到,只要样本量够大(每组 30040.84 个样本以上),就算是很微弱的差异,也能被检测到(而且是极显著的)。
以上例子只是简化对于之前问题的理解,实际上的计算过程会要复杂得多(我也不会)。从结果上来看,或许有时候支持率确实不能成为我们判断系统发育关系是否准确的唯一标准,但也不必因此过多重视 GCF 和 SCF 而忽视了支持率信息,正如文章中所提到:
One measure is not better or worse than the other, rather, concordance factors provide useful information that bootstraps do not, and vice versa.
衡量标准没有好坏之分,一致性因子提供了一些自助法没有提供的信息,反之亦然。